Clinical ISAS Analysis Details
The contents of this webpage describe the details of the ISAS
Analysis using BioImage Suite. The
process is broken down into five phases
- Before you Begin
- Getting Started (1.1 - 1.2)
- Registering the Patient Scans (2.1 - 2.3)
- Performing ISAS BioImage Suite (3.1 - 3.2)
- Subtraction Processing (4.1)
Part 0: Before you Begin
Before you begin analyzing you own patient scans, run ISAS on our
sample patient data.
Once your results
match ours, you can be confident that you are successfuly implementing the process.
Analyze Format
Before beginning the ISAS analysis, verify that the interictal (i.e.
FILENAME_INT.img)
and ictal (i.e.
FILENAME_ICT.img) SPECT scans are in the ANALYZE format
(for more information go to the
Software Setup
page).
Lowercase File Extensions
The extensions of the Analyze format files need to be in
lowercase letters (i.e.
FILENAME.img rather than
FILENAME.IMG).
Note: You can use the DOS rename
command within the image directory (ie.
"rename *.IMG *.img")
or manually rename the files so the extensions
are lowercase.
Starting BioImage Suite
Once BioImage Suite is correctly installed, it can be started like most other applications. Generally for
Windows, this involves going to "All Programs" under the "Start" menu and looking for the BioImage Suite shortcut.
By selecting "BioImage Suite Menu", the BioImage Suite main menu should start.
Part 1: Getting Started
Prior to preforming the preprocessing step and running statistical model,
a datatree must be created in BioImage Suite.
1.1 Reorient Images:
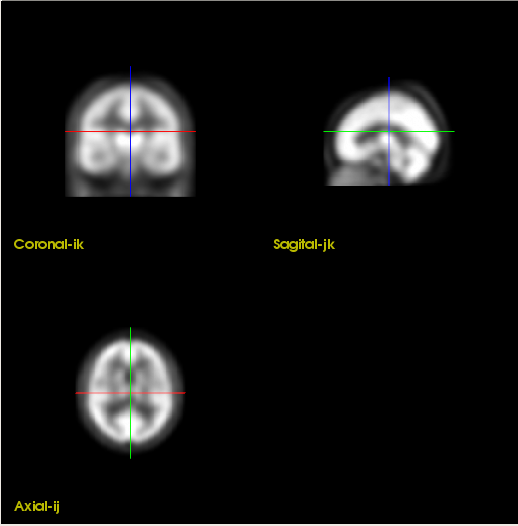
Check the orientation of your images. All images (ictal SPECT, interictal SPECT, MRI)
should be in radiogical convention and have a similar orientation to the image below.
- Open the Orthogonal Viewer tool by clicking
Orthogonal Viewer on the main menu.
- Click "File" in the menubar, then choose "Load". Select the image you want to check the orientation of.
- If the image has a different orientation than the figure above, click "Image Processing" in the menubar
and then choose "Reslice Image". The Image Processing Utility should now appear.
- In the Image Processing Utility, change the "Transform" dropbox to the last option,
"Custom Rotation". You can manipulate the image by changing "RotX", "RotY", and "RotZ"
and then clicking the Reslice Image button near the bottom of the utility.
If the image is "flipped", an rotation 180° about the appropriate axis will correct
the orientation. Hint: try a RotX value of 180° to correct the orientation of the sample data.
- Once the image is orientated correctly, click on "File" in the viewer's
menubar and choose "Save". "Reslice" will be added by default to the name of the image.
1.2 Setting Up the Datatree:
The user interface for ISAS BioImage Suite is design intergrate directly with the Data Tree Manager of BioImage Suite. For more information on the
Data Tree Manager see the
Data Tree Chapter in the BioImage Suite Manual.
- Open the Data Tree Manager in BioImage Suite. From the main BioImage Suite menu,
choose the Neurosurgery tab and then Data Tree Manager.
- Click "File" in the menubar of the Data Tree Manger, then choose
"Switch Directories". Select the appropriate working directory. Generally this is the directory where the data is stored and way
analysis files are to be stored.
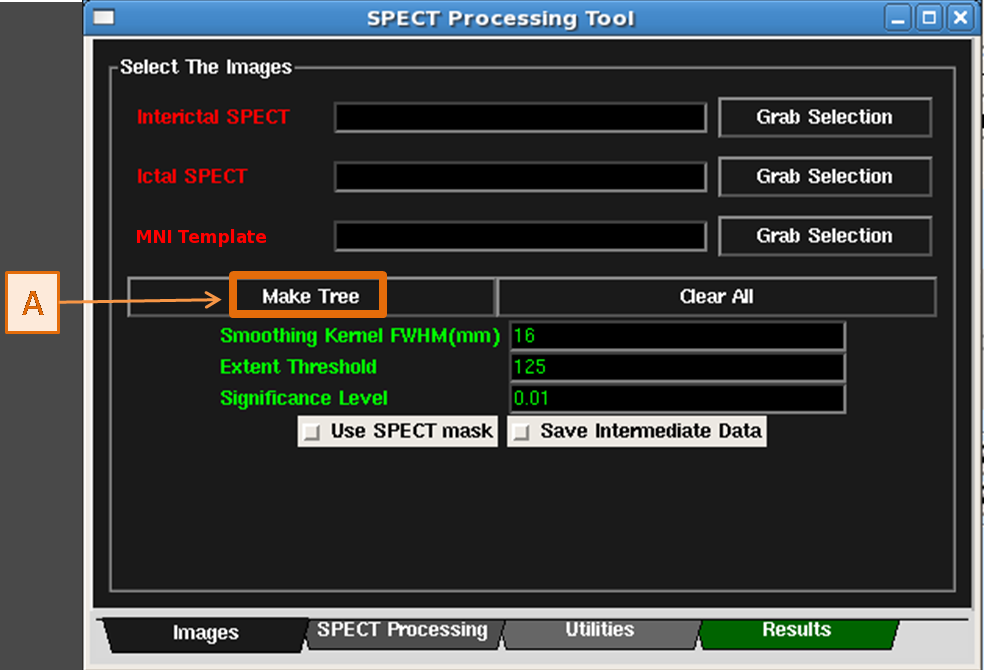
- Click "Tools" in the menubar of the Data Tree Manger, then choose
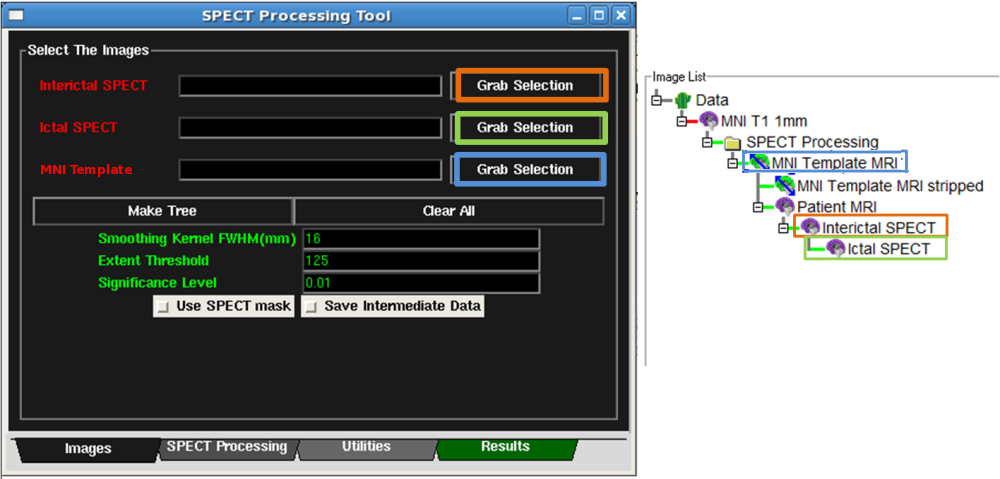
"SPECT Processing Tool". The SPECT Processing Tool will pop up.
- In the Images Tab of the SPECT Processing Tool, click the Make Tree button. See figure below.
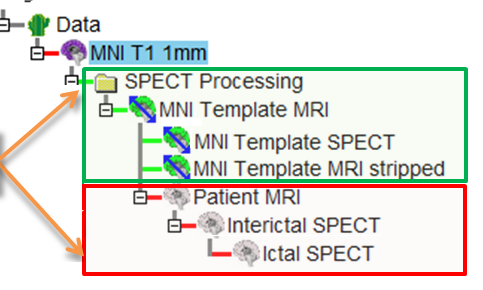
- This creates a new datatree in the Data Tree Manager with the images and transformations
for the MNI Template MRI, MNI Template MRI stripped brain, and MNI
Template SPECT set. (See Figure below)
- The required nodes that are not yet specified, i.e. Interictal SPECT, Ictal SPECT, Patient MRI,
are gray and inserted into the tree as well. (See Figure below)
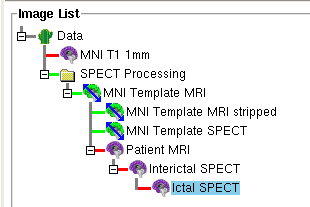
- In the Data Tree Manager, right click on the Ictal SPECT node and select "Set Filename". Browse
to find the appropriate file that corresponds to the patient's ictal SPECT with the corrected orientation.
- Similarly, right click on the Interictal SPECT node and select "Set Filename". This time choose
the filename that corresponds to the patient's interictal SPECT with corrected orientation.
- If a high resolution patient MRI is available, right click on the Patient MRI node and select
"Set Filename". This time choose the filename that corresponds to the patient's MRI.
- After all the images are loaded, the ictal, the interictal, and (optionally) the MRI node should be purple as in the Figure below
Part 2: Registering the Patient scans
In this section, we register the patient's images to each other and then to the template image.
2.1 Registering the SPECT images
First register the ictal SPECT to the interictal SPECT using a rigid transformation.
- Selecting the SPECT images.
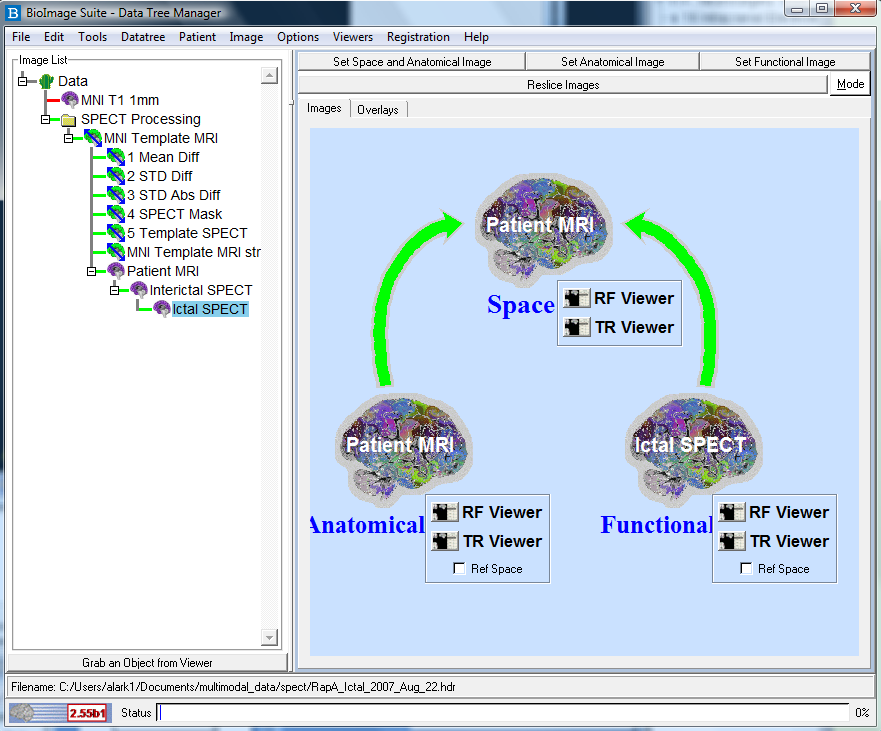
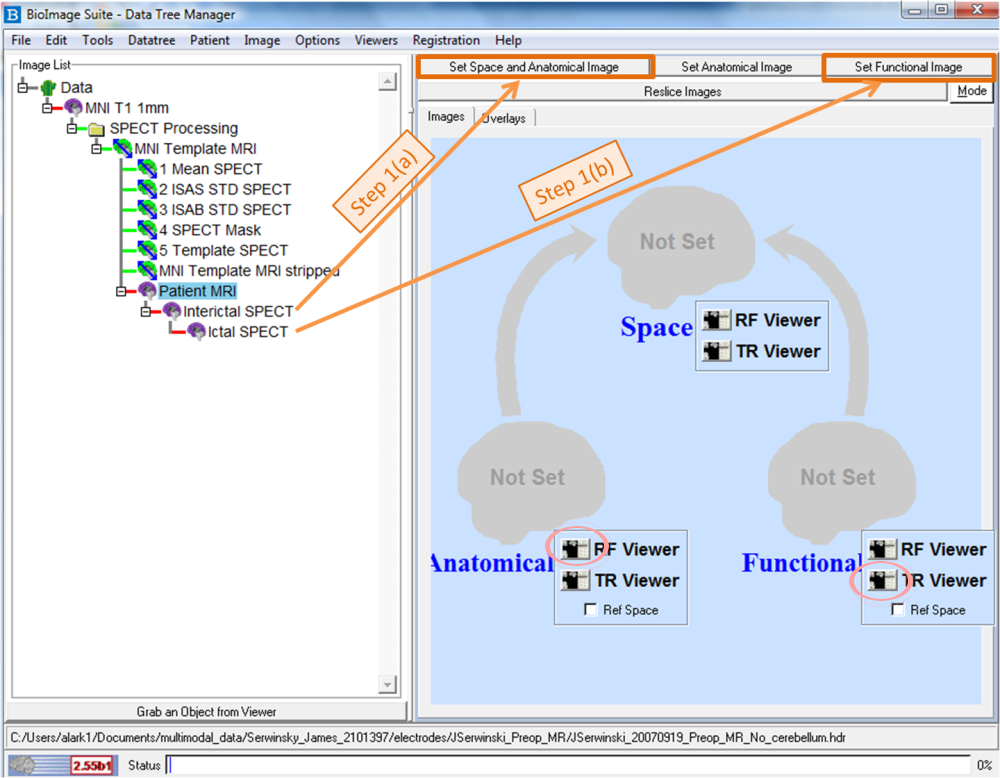
- On the Data Tree Manager, highlight the Interictal SPECT node
and click the Set Space/Anatomical Image button. See Figure below.
- Highlight the Ictal SPECT node on the Data Tree Manager and click the Set Functional Image button (not the right-click menu option).
See Figure below.
- Send each of these images to the viewers by clicking the RF Viewer button for Anatomical
image and the TR Viewer button for the functional image. The buttons are circled in FIgure . This sends the interictal SPECT to the "Reference"
viewer and the ictal SPECT to the "Transform" viewer.
- In the Data Tree Manager menubar, click "Registration", and then "Linear Registration." The
Registration/Overlay Tool should pop up in a new dialog box.
- To perform the registration of the Ictal SPECT to the Interictal SPECT, ensure the Auto Save Results
button is checked and click the Rigid button. Once the registration is complete,
a message box should pop up displaying where the transformation was saved.
- Since registration a the critical step for performing ISAS, it is important to double
check the quality of the registration.
- Arrange the Reference and Transform viewers on the screen so both are visible at the same time.
- Check the registration by clicking on anatomical landmarks on the image in the Reference viewer.
The cross-hair on the Transform viewer should now align with the same landmark.
- In most cases, automatic registration is more than accurate enough for ISAS.
However, if the registration is not satisfactory, there are several debugging steps.
- First, double check that the images are oriented similar to this figure. If the images are not
orientated correctly, See here for details on reorienting the image.
- Second, use the manual registration utility to manually align the images and
then rerun the automatic registration. Please see the Linear Registration Chapter for
more information on how to use the manual registration tool.
- Third, use the manual registration utility to manually align the images, save the transformation,
and use this transformation instead of the automatic registration in the remainder of the analysis.
- In the Data Tree Manager, right-click on the Ictal SPECT node,
select "Load Transformation From
Parent," and load the automatically saved *.matr file corresponding
to the transformation of the Interictal SPECT to the Patient MRI.
2.2 Registering to the Patient's MRI
Note: This section is only necessary if you want to use the patient's MRI for co-registration.
If you do not have the patient's MRI, right-click on the Interictal SPECT node, in the Data Tree Manager,
and select "(Un)Set as Identity". Then, continue on to the next section
Registering into MNI Common Space.
- If the patient's MRI exists, perform the same registration steps as above with the
patient MRI as the "Space/Anatomical Image" and the interictal SPECT as the "Functional Image"
to register the interictal SPECT to the patient's MRI.
- On the Data Tree Manager, highlight the Patient MRI node
and click the Set Space/Anatomical Image button.
- Highlight the interictal SPECT node on the Data Tree Manager
and click the Set Functional Image button.
- Send each of these images to the viewers by clicking the RF Viewer
button for Anatomical image and the TR Viewer button for the functional
image. This sends the patient MRI to the "Reference" viewer and the interictal
SPECT to the "Transform" viewer.
- In the Data Tree Manager menubar, click "Registration", and then "Linear Registration." The
Registration/Overlay Tool should pop up in a new dialog box.
- To perform the registration of the Interictal SPECT to the Patient MRI, ensure the Auto Save Results
button is checked and click the Rigid button. Once the registration is complete,
a message box should pop up displaying where the transformation was saved.
- Since registration a the critical step for performing ISAS, it is important to double
check the quality of the registration. See section
for information on double checking the registration.
- In the Data Tree Manager, right-click on the Interictal SPECT node,
select "Load Transformation From
Parent," and load the automatically saved *.matr file corresponding
to the transformation of the Interictal SPECT to the Patient MRI.
2.3 Registering into MNI Common Space
The last registration step involves co-registering the patients images into MNI common space.
- Selecting the appropriate images for co-registration
- If you have the patient's MRI, on the Data Tree Manager, highlight the MNI Template MRI node
and click the Set Space/Anatomical Image button.
Highlight the Patient MRI node on the Data Tree Manager
and click the Set Functional Image button (not the right-click menu option).
OR
- If you do not have the patient's MRI, on the Data Tree Manager, highlight the MNI Template SPECT node
and click the Set Space/Anatomical Image button.
Highlight the Interictal SPECT node on the Data Tree Manager
and click the Set Functional Image button (not the right-click menu option).
- Send each of these images to the viewers by clicking the RF Viewer
button for Anatomical image and the TR Viewer button for the functional
image. This sends the MNI Template to the "Reference" viewer and the Patient MRI/Interictal
SPECT to the "Transform" viewer.
- In the Data Tree Manager menubar, click "Registration", and then "Non-Linear Registration." The
Registration/Overlay Tool should pop up in a new dialog box.
- To perform the co-registration into MNI space, ensure the Auto Save Results
button is checked and click the Compute Linear + Non-Linear button. Once the registration is complete,
a message box should pop up displaying where the transformation was saved. This step may take a little while.
- For non-linear registrations, the inverse transformation must be explicitly calculated.
- First click on the Transformation Tab of the Registration/Overlay Tool.
- In the list of transformations on the left had side of the tab,
select the non-linear *.grd file specifying the transformation between the Patient Space and MNI Common Space.
It should be the last transformation in the list and already highlighted.
- Click the Invert button located to the right.
- Once the transformation is inverted, click the Save button
to save the new *.grd file. The default name will be "Inverse_*.grd".
- Once finished registering into MNI Common Space, right-click
on the Patient MRI node in the Data Tree Manger, select "Load Transformation From
Parent," and load the automatically saved *.grd file corresponding to the transformation into MNI Common Space.
- Next, right click on the Patient MRI node, select
"Load Transformation To Parent," and load the
saved "Invert_*.grd" file corresponding to the inverted registration MNI Common Space.
Note: All node lines between image should be green at this
point as in the Figure below. The green lines indicates that the
transformations between the images are set. More information on performing
registrations in BioImage Suite can be found in
Linear Registration Chapter
and
Non-Linear Registration Chapter of the BioImage Suite Manual.
Part 3: Performing ISAS BioImage Suite
3.1 Calculating Voxel By Voxel Significance
Here, we create the tmap image (a image where each voxel represents a t-statistic) that will be used in calculation cluster-level statistics.
In this step, the transformation calulated in the previous steps are applied, the images are smoothed, masked, and intensity normilized, and comparisions
are made to the healthy normal population.
- First, select the Interictal SPECT node on the Data Tree Manager.
Then click the corresponding Grab Selection button on the Images
Tab of the SPECT Tool. See Figure below. The Interictal text should
turn green once the image is set.
- Second, select the Ictal SPECT node on the Data Tree Manager.
Then click the corresponding Grab Selection button on the Images
Tab of the SPECT Tool. See Figure below. The Ictal text should
turn green once the image is set.
- Third, select the MNI Template MRI node on the Data Tree Manager.
Then click the corresponding Grab Selection button on the Images
Tab of the SPECT Tool. See Figure below. The MNI Template text should
turn green once the image is set.
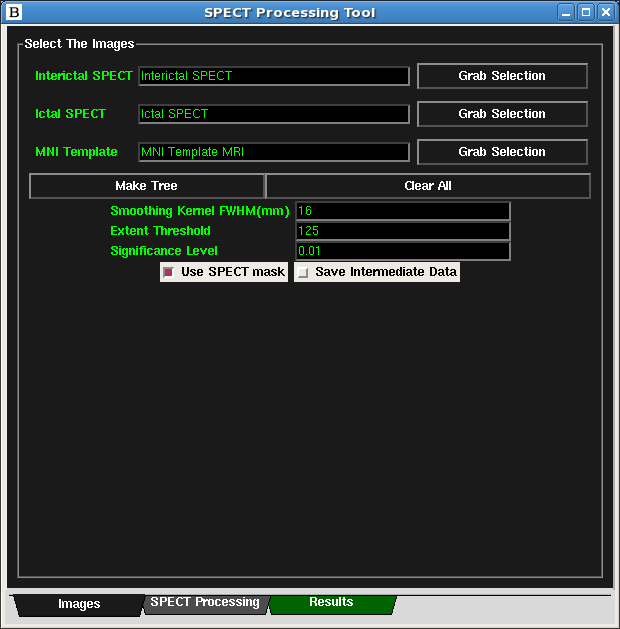
- At this point, all the necessary images should be set and the text should turn green. The Figure below
- (Optionally) To save all intermediate images, check the "Save Intermediate Data" check-box. This option will make ISAS BioImage Suite run slower.
- Click on the SPECT Processing Tab of the SPECT Processing Tool. Then
click on either the ISAS_Processing or ISASHN_Processing buttons to begin.
- The outputs for ISAS will be stored in the datatree under the MNI Template MRI.
The default outputs are the Preprocessed_Ictal image,
Preprocessed_Interictal image, the TMAP image, and the Perfusion Blobs image.
The outputs for the Subtraction Processing will be stored under the interictal SPECT node
3.2 Calculating Cluster Level Significance
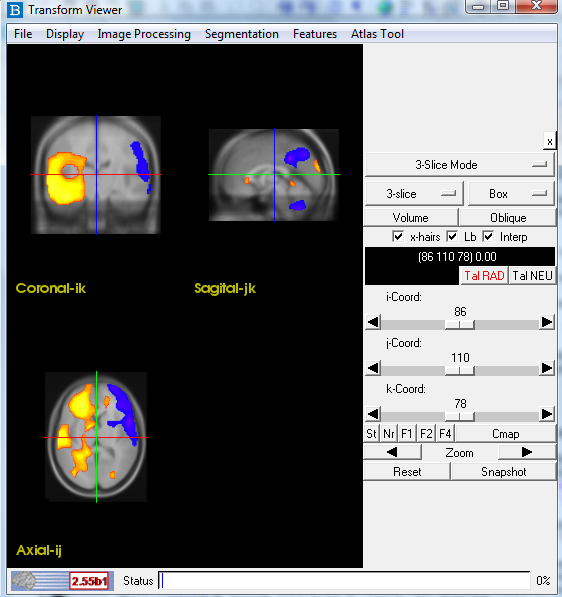
Here, we will calculate cluster significance and navigate using an overlay the the tmap onto the MNI Template MRI.
- Create an overlay of the Perfusion Blobs onto the MNI Template MRI.
Figure shows the Perfusion Blobs overlayed on a template MRI.
- Highlight the MNI Template MRI node on the Data Tree Manager.
Then, click the Set Space/Anatomical Image button located to the right.
- Highlight the Perfusion Blobs node on the datatree and click the Set Functional Image button (not the right-click menu option)..
- Click the Reslice Images button locate under the Set Space/Anatomical Image button.
- In the Overlays Tab of the Data Tree Manager (locate below the
Reslice Images button), set the low threshold to zero and click the Create Overlay button.
- The transform viewer should now show the Perfusion Blobs overlayed on to the Template MRI.
- On the SPECT Tool, click on the Results Tab and set the TMAP image with
the TMAP node on the datatree.
- Click either the Hyperperfusion Statistics button or the
Hypoperfusion Statistics button to calculate the cluster level statistics.
The cluster size, cluster p-value, corrected p-value, the maximum tscore, and XYZ
coordinates of the maximum tscore will be displayed on the Results Tab.
- The Set Crosshairs buttons can be used to navigate the Transform
Viewer to the XYZ coordinates of the maximum tscore.
- A printout of the statistics can be save using the the Save button at the bottum of the application
Part 4: Subtraction Processing
Here, we describe how to perform a double check for against any processing errors the may have been introduced during the running of ISAS BioImage Suite.
This analysis is automatically done if ISAS BioImage Suite was run from the SPECT tool in the datatree, but it can be performed on its own.
4.1 Subtraction Analysis
- First, select the Interictal SPECT node on the Data Tree Manager.
Then click the corresponding Grab Selection button on the Images
Tab of the SPECT Tool. The Interictal text should
turn green once the image is set.
- Second, select the Ictal SPECT node on the Data Tree Manager.
Then click the corresponding Grab Selection button on the Images
Tab of the SPECT Tool. The Ictal text should
turn green once the image is set.
- At this point, all the necessary images should be set and the text should turn green.
- Click on the SPECT Processing Tab of the SPECT Processing Tool. Then
click on either the Subtraction_Processing buttons to begin.
- The resulting image will be stored under the interictal node on the data tree
Back to Analysis Summary
||
Jump to Top
||
Forward to Displaying Results


